The NanoVNA is an amazing little instrument that puts test capabilities into the hands of hobbyists that were once only found on laboratory benches. One thing I wanted to do with mine was to measure capacitance and inductance without reading it directly from the Smith chart. To do this I started out making a jig from a couple SMA connectors and a terminal block. I used two connectors because eventually I want to use it to test filters, but for now I'm just using one terminal.
As you'll see, this isn't really a tutorial or how-to. It's my on-line lab notebook, complete with errors and unsolved puzzles. This was also an excuse to familiarize myself with a LaTeX equation editor plug-in.
To calculate the capacitance and inductance, you need to first measure reactance. Reactance is the characteristic of capacitors and inductors that opposes alternating current. I attempted to measure the reactance of two components:
A ceramic capacitor marked "65 - J" - a 65 picofarad capacitor.
An inductor made from a T37-6 Toroid with ten turns of magnet wire. According to this website: https://toroids.info/T37-6.php, the inductance should be 0.30 microhenries.
Here's the setup:
From the base menu select only one trace:DISPLAY, TRACE, TRACE 0
Set reactance for capacitors and inductors: DISPLAY, FORMAT, MORE, REACTANCE
Select port: DISPLAY, CHANNEL, CH0 REFLECT.
Set a frequency start and stop STIMULUS, START, 1M, STOP, 30M
Adjust the scale and offset for a full screen graph: DISPLAY, SCALE, SCALE/DIV, <###>, REFERENCE POSITION <###>
Now perform a calibration (CAL, CALIBRATE) using the provided open, short, and load standards. Applying them at the end of the short test lead, rather than at the chassis NanoVNA should yield the best results.
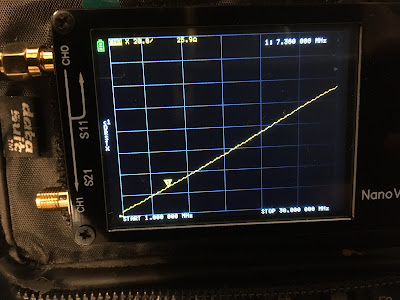
The Nano VNA displays reactance in ohms on the top center and frequency on the top right. Note that the reactance is negative because our load is capacitive.
Capacitors typically have a tolerance of 20% which means that the measured value of this 65 picofarad capacitor was correct almost all the way to 30 Mhz. It's strange that the error changed with frequency.
It looks like the point at which the reactance lines cross is about 24 MHz, significantly lower than the 29.4 MHz resonance. Because of the shallow slope of the lines, capacitance only has to be a little lower or the inductance a little higher to move the crossover point significantly, so maybe this method's not too practical.
- Why did the values of capacitance and inductance increase with frequency?
- Would I have gotten better results if I had chosen a capacitance that results in a steeper slope?
- Can I obtain a more accurate measurement if I construct RC and RL filters using high precision resistors and calculate C and L based on their their 3 dB attenuation points?


