Showing posts with label Ham Radio. Show all posts

Tuesday, January 14, 2025

Arduino Controlled VFO with OLED Display

When I saw this post in Hackaday about a DIY software defined radio receiver, what interested me most was the Tayloe mixer.  That lead me right down a rabbit hole. It's an ingenious design that lets you extract in-phase and quadrature signals so that you can do single side band (SSB) modulation/demodulation. It seemed like a excellent choice for a home-brew transceiver. Within this rabbit warren that I had entered, there were all kinds of designs, including some from The ARRL Handbook for Radio Communications. These designs needed relatively few parts: an oscillator, some analog switches, and an amplifier. The starting point is the variable frequency oscillator (VFO). The trick is that it needs to generate two square waves, one of them with a 90 degree phase offset. 

I had some Si5351 clock generators about, so I chose that as a starting point. There are two ways to accomplish quadrature clock signals with that chip. 

  • Generate a square wave at 4 times the frequency of interest, and create the quadrature clock signals using flip-flops.
  • Use the phase settings on the Si5351 clock generator to generate two clock signals, 90 degrees out  of phase.

So naturally, I chose the second option. That would be easiest, right? Nope.

I started with the examples in the etherkit libarary. At first I thought I could get away with just the set_freq and set_phase functions. It turns out that set freq automatically handles some settings in a way that conflicts with some of the phase setting rules. I would need to learn these rules and use the set_freq_manual function.

These are the rules:

  • The PLL (Phase Locked Loop) frequency must be set between 600 MHz and 900 MHz.
  • The PLL frequency must be must be a multiple of between 1 and 128 times the output frequency.
  • The multiple, when applied to the set_phase function, is equal to a phase shift of 90 degrees.
I made a spreadsheet to help figure this out. All the frequencies are in tens of milli hertz. The Si5351 takes frequencies as Unsigned Long Long integers. For each of the HF amateur bands, I tried to figure out an acceptable PLL frequency and multiplier (marked here as "phase"). I was able to do this for all but the 80 meter band. Oh well, I don't have room for an antenna that big!

Using the above table, I was able to independently frequency and phase using set_freq_manual and set_phase.

Next, I needed a way to control the Si5351. I based my circuit and code on work done by Peter, VK3TPM and Paul, VK3HN

Shopping List


Schematic

Code

The current Arduino file is: dc-vfo-06.ino. It makes the following improvements to the original design:

Frequency display is grouped by 1000s.
Add an arrow pointing to the digit or band being adjusted.
When the arrow points to the MHz place, the band is adjusted.
Frequency limits for each band.
Frequency memory for each band.

To use the VFO click the button on the encoder to select the place or band.
Spin the wheel to adjust the place or band. 

Here's the VFO in action. I'm using an inductive probe to connect the Tiny SA, which is showing the frequency. The phase relation ship is displayed on the oscilloscope. The Si5351 output is a 10 MHz square wave, but it looks like a sine because the scope is limited to 20 MHz.


To Do Next

Automatically switch sidebands based on selected band.
Display current sideband.
Add a momentary center-off toggle switch to select the digit being adjusted.
Design, implement, and test the mixer.


Saturday, December 23, 2023

APRS monitor with Raspberry PI

 APRS is a digital communication mode using a VHF radio, a modem, and a computer. Packets are sent over the air in a manner similar to the internet. It's used to send text messages, email, weather reports, and positions of emergency response assets.

Years ago I bought a muli-color LCD display from Adafruit for my Raspberry Pi 2. I finally got around to assembling it and was looking for an application. I figured if I wrote an app to monitor and decode APRS packets it would be an opportunity to better understand this interesting protocol.

The first part of this system consists of a Baofeng BF-F8HP radio and a interface board that I described in an earlier post. The Raspberry Pi 2 has no audio input, so I had to use a USB sound card dongle.  This used up one of the Pi's two USB ports. I was going to plug the Pi's other port into the interface board's "Push to Talk" (PTT) port, and then get the Pi on the network using an Ethernet cable, but since the code I'm running is very experimental, I thought it more prudent to use a WiFi dongle on the second port and keep the Pi on my guest network. Although PTT is not needed for this part of the project, I should be able to add it later using the Pi's GPIO pins.

I installed Direwolf,  a Terminal Node Controller (or modem), on the Pi with "sudo apt install direwolf". The sound card configuration in direwolf/config file looks like this:

ADEVICE  plughw:1,0
ACHANNELS 1

I started ~/direwolf/direwolf but it wasn't decoding the received messages. There turned out to be two problems with the soundcard dongle. One was that it couldn't handle the nearly 4 volt DC offset coming from the Baofeng, and the other issue was that the dongle was expecting microphone level signals. To handle the offset I added 0.15 µF capacitor to the signal line. Next I cut the signal level down by a factor of 20 by making a voltage divider using a 470 ohm resistor and a 10K ohm resistor.

Now for the Python stuff. I wanted to make a networked connection to Direwolf's so-called KISS (Keep It Simple Stupid) interface. I reality, I don't think it's that simple! I looked at two ways to access this interface. Using the Python KISS library, or just opening a TCP socket. 

Capturing packets in KISS 

    ki = kiss.TCPKISS(host='localhost', port=8001)
    ki.start()
    ki.read(callback=print_frame2)

Capturing Packets with a TCP socket

sock = socket.socket(socket.AF_INET, socket.SOCK_STREAM)
server_address = ('localhost', TCP_PORT)
sock.connect(server_address)
while(True):
    data = sock.recv(1024)

I settled on the KISS library because I was hoping that it would handle much of the packet assembly and disassembly. It was a little trickier that I though. I had to import the parse functions from both the aprs library and the aprslib library. These two functions do slightly different things. The aprs function really does a decode, and the aprslib function does the actual parsing.

        decoded_msg = str(aprs.parse_frame(msg))
        decoded_msg = decoded_msg.replace('*','')
        print('Decoded Message  = ' + decoded_msg)
        parsed_msg = aprslib.parse(decoded_msg)
        prettyprint.prettyprint(parsed_msg)

But in the end they turn this into a key-value dictionary:

b'\x82\xa0\xa8fbh`\x82\x90l\x8e\xa4@l\x96\x90l\x86\x9e\x9a\xe2\xae\x92\x88\x8ab@\xe0\x96\x90l\x84\x8c\x88\xe3\x03\xf0$GPRMC,054034,A,2048.6686,N,15622.0367,W,011,344,191223,,*00/Mobile in Maui Hawaii|#t%{|!wo^!'

I found that there were a few cases in which these functions were unable to parse a message. That will be something for me to figure out later.

Next I wanted to use the LCD display to show the SSID (station callsign + an identifying number) of the calling station, the time the message was received, and the location from which the message was sent. The SSID comes from the "from" key in the parsed message. The time comes from the system clock. The latitude and longitude are in the parsed data, but I wanted to show the name of the nearest town. For this, I found that a website that offers "reverse geo-coding". You supply the coordinates and it returns the name of the nearest town.  

Here's how the current state of the project looks:


Next: 

Add meaning to the colors. Currently the screen backlight color is random. Each type of message (position, wx report, text) should have an assigned color.

Add the ability to transmit. 


Sunday, October 10, 2021

Optimizing Yagi Design Parameters

There are so many different Yagi designs published in books, magazines, and on the web. But what's the difference between them? For a basic three-element Yagi, design parameters include the spacing, length, and diameter of the elements. Performance parameters include standing wave ratio (SWR) characteristics, gain, and front-to-back ratios. When I see a design, I wonder what the designer's goals were, and if I change one parameter, how will other parameters be affected? 

I started out with the impressive National Bureau of Standards Technical Note 688, titled Yagi Antenna Design. The author built antennas and measured their performance as parameters were varied. I wanted to do something similar using NEC2 simulation software in an effort to understand the relationship between design and performance parameters. I used the PyNEC library so I could programmatically try many different combinations. Using a Python script is much more efficient than using any of the NEC2 applications, because I can simulate and compare hundreds of configurations in a matter of minutes. 

Starting with one of the basic three-element Yagi designs in the technical note, I noticed that the spacing between the elements was the same, and that the spacing was one quarter of the antenna's design wavelength. What would happen if the spacing between elements remained equal, but was increased or decreased. I updated the script yagi_3_element.py to measure the forward antenna gain and plot it. And wouldn't you know it? The script predicted maximum gain at one-quarter wavelength which matched what was measured in the technical note.


The radiation pattern shows a forward gain of almost 9.

And the SWR across the VHF ham band is only slightly more than two, which is easily handled by most radios. 


Then the next question was: could gain be increased with unequal spacing? I wrote yagi_optimize_spacing.py to independently vary the two spacing parameters, creating a surface and plotting it. 

The answer was yes. Gain was increased slightly: half a dB. This could be done by increasing the director spacing to 0.325 λ and reducing the reflector spacing to 0.055 λ, but that seemed really strange. I've never seen an antenna like that, there had to be a catch. Plotting the SWR revealed the problem. 


The SWR was super-high. The complex matching network required for an antenna such as this would more than cancel any of the gain improvement. 

So what I learned was that quarter-wavelength spacing is best for a three-element Yagi. 

The next questions are: what happens if the element lengths are varied? How do Yagis with arbitrary numbers of elements behave? And, if I build one of these on my workbench, how closely will its performance match these designs? 

Sunday, October 13, 2019

Setting Linux USB for ic-7300 and fldigi

It took me a while to figure out how to set this up, so here are a few notes.

The first issue was that the user needs dialout privileges.

$ sudo usermod -a -G dialout $USER

The user may also need to get audio privileges. Check settings like this:

$ id
uid=1000(tester) gid=1000(tester) groups=1000(username),4(adm),20(dialout),24(cdrom),27(sudo),29(audio),30(dip),46(plugdev),112(lpadmin),129(sambashare)


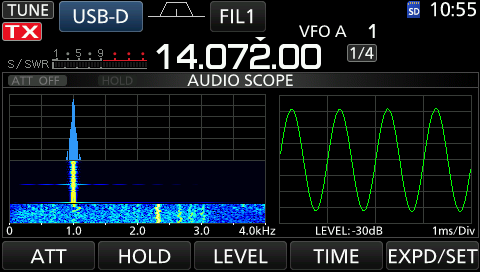
The next issue was that the old laptop I was sending a corrupted signal. Looking at the audio FFT on the 7300, I could see that the image had wide "skirts". Maybe old laptop wasn't up to the job. I found out later that fldigi has a checkbox for "slow cpu" under "misc", "cpu". That might have fixed it, but I just switched to a desktop computer and now the audio FFT now looks something this: