Showing posts with label Arduino. Show all posts

Tuesday, January 14, 2025

Arduino Controlled VFO with OLED Display

When I saw this post in Hackaday about a DIY software defined radio receiver, what interested me most was the Tayloe mixer.  That lead me right down a rabbit hole. It's an ingenious design that lets you extract in-phase and quadrature signals so that you can do single side band (SSB) modulation/demodulation. It seemed like a excellent choice for a home-brew transceiver. Within this rabbit warren that I had entered, there were all kinds of designs, including some from The ARRL Handbook for Radio Communications. These designs needed relatively few parts: an oscillator, some analog switches, and an amplifier. The starting point is the variable frequency oscillator (VFO). The trick is that it needs to generate two square waves, one of them with a 90 degree phase offset. 

I had some Si5351 clock generators about, so I chose that as a starting point. There are two ways to accomplish quadrature clock signals with that chip. 

  • Generate a square wave at 4 times the frequency of interest, and create the quadrature clock signals using flip-flops.
  • Use the phase settings on the Si5351 clock generator to generate two clock signals, 90 degrees out  of phase.

So naturally, I chose the second option. That would be easiest, right? Nope.

I started with the examples in the etherkit libarary. At first I thought I could get away with just the set_freq and set_phase functions. It turns out that set freq automatically handles some settings in a way that conflicts with some of the phase setting rules. I would need to learn these rules and use the set_freq_manual function.

These are the rules:

  • The PLL (Phase Locked Loop) frequency must be set between 600 MHz and 900 MHz.
  • The PLL frequency must be must be a multiple of between 1 and 128 times the output frequency.
  • The multiple, when applied to the set_phase function, is equal to a phase shift of 90 degrees.
I made a spreadsheet to help figure this out. All the frequencies are in tens of milli hertz. The Si5351 takes frequencies as Unsigned Long Long integers. For each of the HF amateur bands, I tried to figure out an acceptable PLL frequency and multiplier (marked here as "phase"). I was able to do this for all but the 80 meter band. Oh well, I don't have room for an antenna that big!

Using the above table, I was able to independently frequency and phase using set_freq_manual and set_phase.

Next, I needed a way to control the Si5351. I based my circuit and code on work done by Peter, VK3TPM and Paul, VK3HN. 

Shopping List


Schematic: 

Code

The current Arduino file is: dc-vfo-06.ino. It makes the following improvements to the original design:

Frequency display is grouped by 1000s.
Add an arrow pointing to the digit or band being adjusted.
When the arrow points to the MHz place, the band is adjusted.
Frequency limits for each band.
Frequency memory for each band.

To use the VFO click the button on the encoder to select the place or band.
Spin the wheel to adjust the place or band. 

Here's the VFO in action. I'm using an inductive probe to connect the Tiny SA, which is showing the frequency. The phase relation ship is displayed on the oscilloscope. The Si5351 output is a 10 MHz square wave, but it looks like a sine because the scope is limited to 20 MHz.


To Do Next

Automatically switch sidebands based on selected band.
Display current sideband.
Add a momentary center-off toggle switch to select the digit being adjusted.
Design, implement, and test the mixer.


Saturday, December 19, 2020

Tomato Cage Repurposed as a Greenhouse

Winter is coming to Northern California, and with it comes the potential for plant-killing hard freezes. To protect frost-sensitive potted plants, I turned this summer's tomato cage into a greenhouse.

I had made a 5 foot high, 7 foot wide and two foot deep tomato cage frame out of PVC irrigation pipe and strung twine back and forth to support the tomatoes. Now that tomato season is over, I repurposed it as a green house. For the walls I used 20 mil plastic sheeting. The door has a flap in the front that rolls up. It's held in place by adhesive-backed Velcro. To keep rain from pooling on top, I made a support for a peaked roof out of PVC pipe.

This is the result at night with a flashlight inside. Looks kinda cool, huh?

Unfortunately the greenhouse wasn't really getting warm inside. At the time I was listening to Prof. Richard Pogge's Astronomy 161 lecture on the planet Venus and its runaway greenhouse effect. I realized that the sunlight was just passing through my greenhouse. I needed something to capture the visible light entering the greenhouse and convert it to infrared which couldn't escape though the plastic sheeting. I reworked the peaked roof into an angled roof, and along the back wall of the greenhouse I hung some black shade cloth. 

Now it was getting up to 120 degrees at the ceiling! So I took a small solar panel, a motor from an old cassette player, and a propeller from a Cox model airplane and made a fan to mix around the air when the sun was shining.


I had used strips of adhesive backed Velcro to keep the front closed, but in someplaces where the sheeting was slightly damp, the adhesive didn't stick at all. And, in other places where it did stick well the strip was too wide and the sheeting was going to tear before the Velcro released. To fix these two problems, I got some plastic plumbers strapping, some pop-rivets, and washers to securely fasten the Velcro. If I had had some on hard, I would have used narrower Velcro strips to make easier to open the front flap. Instead I just covered half the width of the strap with duct tape.


Now, how well does it work? Enter the return of the garden logger.

I added a DHT22 temperature/humidity sensor and three DS18B20 "one wire" temperature probes. These probes are waterproof so I used them for both outside air and soil temperature measurement. Note that I used one data pin per DS18B20 sensor, even though they are designed to all connect to a single wire. This allowed simpler software at the expense of more complex hardware. If I ever start running low on data pins, I can reclaim the two wires I wasted and re-write the software. You can find the current Arduino sketch on Github.


I mounted the logger inside a Japanese bento box, and ran the wires to an Euro-style terminal strip mounted on the lid. The light sensor and DHT22 temperature/humidity sensor were glued to the lid with epoxy.


I put the garden logger on a bench inside the greenhouse, powering it up from a USB power supply connected to an extension cord. I let it run for a couple days. Here's what the temperatures look like.

When the sun was shining, it was much warmer in the greenhouse. Then as temperatures dropped, everything seemed to equalize, and it really wasn't much warmer inside. Then at 2:00 am there was a sudden temperature drop outside, and the temperature inside stayed about 5 degrees warmer. I'm not sure why that happened, but I think I need to improve the insulation by adding another layer of plastic sheeting. 

Just for fun, I've plotted all data channels. You can see that in November when these measurements were taken, the greenhouse gets only 6 hours of maximum sun, and as soon as things start to cool off, humidity hits 100% and water starts condensing inside.


I've been thinking that perhaps I could better measure the performance of the greenhouse -  eliminating day to day weather variations, by convolving the inside temperature history with the outside temperature history. The goal would be to determine the thermal analog of electrical impedance for the greenhouse. I've Googled this and found a few scholarly papers on the subject. However, that will have to be a subject for another blog post.

Saturday, July 4, 2020

Garden Logger

How many hours of sun does each raised bed in the garden get? How moist is the soil? How fast does it dry out, and how does that correlate with the air temperature?  And, how does all of that correlate with the productivity of a given crop type?

The first step towards finding those answers is to collect data. I'm starting simply with just measuring the hours of full sun and logging it to an SD card once per minute. The circuit consists of a CdS photocell in a  half bridge configuration connected to one of an Arduino's analog inputs. The resistance of the photocell is calculated in the Arduino sketch which was probably isn't a great idea, since it's going to need to be post-processed anyway. I have yet to figure out how to calibrate the photocell so that the results can be displayed in units of luminous intensity, but, regardless I should have just logged the output in raw A to D bits.

The date and time of day is stored in a Real Time Clock (RTC), which is part of the logger that I got from Amazon. The RTC had to be programmed once before loading the logger sketch.

Arduino sketch reads the resistance of the photocell and the time and date on the clock, and stores it to the SD card. After sitting all day in the sun, covered by a piece of cardboard (except for the photocell), I bring the card in and add a description of the logged location to the last line of the file, using a tag "Title:".


The log file looks like this:

2020/06/23T20:10:14, 395.9
2020/06/23T20:11:14, 406.5
2020/06/23T20:12:14, 417.1
2020/06/23T20:13:14, 449.0
2020/06/23T20:14:14, 449.0
2020/06/23T20:15:14, 470.3
Title: Bed 2

To get plots of the solar intensity, I wrote a Python script that uses matplotlib. The brighter the sun, the lower the resistance. Full sun is about 25 ohms. As each location is plotted, the number of hours of full sun is calculated. Full sun is assumed to be when the resistance is less that 75 ohms. The number of full sun hours is often less than the stop time minus the start time. This is because the trees or other objects sometimes obscure the sun over the course of the day.


For each plot I mark the total hours of sun on a diagram of our garden.


This is the hardware:
  • Arduino Uno
  • HiLetGo data logger shield
  • CdS photocell
  • 10 Kohm Resistor

This is the software:


I have some soil moisture and temperature sensors that I'll integrate into the next phase of the project.


Saturday, November 2, 2013

Transcription Controller in an Afternoon

I have some audio files that I need to transcribe. I figured it would be easy just to load them up in the Audacity audio editor and type away. Not so easy. People talk much faster than I can type, and it's hard to control Audacity while trying to type on the word processor. Fortunately, Audacity has keyboard short-cuts. I just need a way to connect a foot pedal to Audacity.

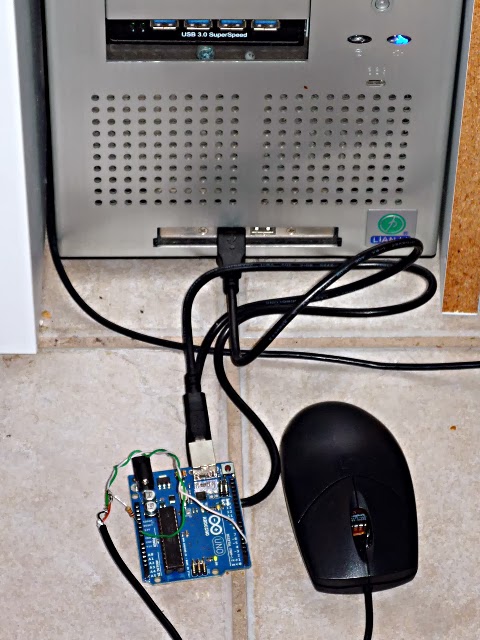
An old PS2 mouse makes a decent foot pedal. I gutted the unit, removing the scroll wheel, and then wired the mouse buttons to the I/O cable.


I then cut off the PS2 connector, and wired it to pin 2 of an Arduino. I also added a 10K pull-up resistor. Here's what it looks like assembled and connected.


 The Arduino was programmed to send the following text strings:

15 seconds after boot: "g"
mouse down: "0"
mouse up: "1"

Here's the code (adapted from Arduino Playground):

// digital pin 2 has a pushbutton attached to it.
int pushButton = 2;
// the setup routine runs once when you press reset:
void setup() {
  // initialize serial communication at 9600 bits per second:
  Serial.begin(9600);
  // make the pushbutton's pin an input:
  pinMode(pushButton, INPUT);
  delay(15000);
}
void loop() {
  Serial.println("g");
  int initButtonState=digitalRead(pushButton);
  //loop forever
  while(1)
  {
    // read the input pin:
    int buttonState = digitalRead(pushButton);
    if(initButtonState != buttonState)
      {
        // print out the state of the button:
        Serial.println(buttonState);
        //debounce
        delay(5);
      }
     initButtonState=buttonState;
   }
 }


I decided to code this in Python because it's a pretty fun and easy language with lots of libraries. But, the first thing I needed was X-windows automation and there seem to be a lot of choices. Even though it's been replaced by Xaut, I found Xautomation worked for me. I got Python and Xautomation from the Linux Mint Software Library, but I could have got them as easily using apt-get.

For each of the received  characters I used Xautomation to sent the following key strokes.


g = space p (start playback and pause)
0 = p (un-pause)
1 = comma comma comma comma comma p (back up a little, then pause)


 The last link was the serial link connecting the Arduino to the Python code. pySerial looked like a good library, and to get it I would need python-pip.

sudo apt-get install python-pippip pySerial

pySerial didn't work at first. I found I had to execute the following commands.

sudo usermod -a -G dialout tester
sudo chmod 777 /dev/ttyACM0

The first command gives you permission to access serial I/O. The second gives you permission to use the particular USB device. Unless you have put these settings in a bash script, you'll have to execute them every time you run the program. Also, depending on your hardware, your USB device may have a different name (like ttyUSB0). The short-cut way to getting pySerial working would be to run Python as root, which is a very bad idea, however.

Here's the code with all in all its ugliness:

# serial_read_keys.py
import time
import serial
from subprocess import Popen, PIPE

control_f4_sequence = '''keydown Control_L
key F4
keyup Control_L
'''

shift_a_sequence = '''keydown Shift_L
key A
keyup Shift_L
'''


initialize_sequence = '''key space
key P
'''


play_sequence = '''key space
'''

unpause_sequence = '''key P
'''

pause_sequence = '''key P
'''

backup_sequence = '''key comma
'''

def keypress(sequence):
    p = Popen(['xte'], stdin=PIPE)
    p.communicate(input=sequence)

ser = serial.Serial('/dev/ttyACM0',9600)

while (1) :
        #print 'reading line'
        rcvChar = ser.readline()
        # print rcvChar
        if 'g' in rcvChar :
            print 'initialize - play and pause'
            keypress(play_sequence)
            time.sleep(0.1)
            keypress(pause_sequence)
        if '0' in rcvChar :
            print 'unpause'
            keypress(unpause_sequence)
        if '1' in rcvChar :
            print 'backup a little then pause'
            keypress(backup_sequence)
            time.sleep(0.1)
            keypress(backup_sequence)
            time.sleep(0.1)
            keypress(backup_sequence)
            time.sleep(0.1)
            keypress(backup_sequence)
            time.sleep(0.1)
            keypress(backup_sequence)
            time.sleep(0.1)
            keypress(pause_sequence)


I had to do some experimentation, and I left all of that in there so I could document what I had learned.

To do transcription, first open your audio file with Audacity. You may want to use the Effect, Change Tempo menu item to slow down the play-back. Now start the Python script. You have 15 seconds to do the following: make sure the Audacity stop button is clicked, then click on the waveform you want to transcribe.

After 15 seconds, the script will click the play button then immediately click pause. Don't touch anything on your screen again. If you do, it will lose focus and the key-presses won't go to Audacity. So, how are you supposed to type the transcription then? Use another computer! I neglected to tell you that, didn't I?

Go to the other computer, mash down on the mouse with you foot and the audio will begin to play. Release the mouse and the audio will back up about 5 seconds and then pause. Why does it back up before pausing? So you can more easily sync up your typing. If you want to back up more double click the mouse.

One unexpected nice feature I found is that when you start the script, it reboots the Arduino, so you don't have to reach down and press the reset button.

Saturday, February 25, 2012

Improving Battery Tester Accuracy

In earlier experiments I found that when powering the Arduino from USB, the battery voltage measurements were all over the place. This is because when the Arduino uses its power supply as the reference voltage for analog conversion, and the power supply isn't precise, neither is the analog measurement precise. It turns out USB power can vary +/-10% and still be in spec.

Accuracy can be improved by adding a reference voltage. I used an LM431Adjustable Precision Zener Shunt Regulator. By the way, when looking for spec sheets it's best to go to the manufacturer's site or to a vendor site, otherwise you may end up in the land of pop-up hell or you may run the risk opening malevolent PDFs.

Normally one would connect the reference output to Vref, but since my battery voltages are over over 2.5 volts, I connected it to one of the analog inputs such as A0.

I then applied the measured reference voltage as a correction factor to each measurement.

batt01 = (float)a1 * 2.5 / (float)a0;

This resulted in much more stable measurements, but unfortunately it didn't improve the repeatably. I repeated charged and discharged the batteries and although some generalizations about each battery can be made, I doesn't seem like it will be possible to compare a battery from one set to a battery in another set. I want to be able to do this so I can regroup the batteries into better performing sets.

Better, but still not good enough. To be able to compare batteries from different sets I would need to see the discharge curve for each battery overlay itself in these test runs. Perhaps the problem is related to the charger. I'll try a different charger and repeat the experiment.

One final improvement I want to make is to the resolution of the graphed data. I'm rounding off the results to to two decimal places. The A-D converter has twice that resolution, so in the future I'll increase the output to three decimal places.

The source code for this project can be found on GitHub as usual.

Saturday, November 5, 2011

Yogurt Maker Part 1

We started building this yogurt maker.

We've completed the TTL controlled power switch and that seems like a pretty useful project by itself. Of course we had to hack the hack and redesign Chris Reilly's implementation to suit our needs and the parts we had on hand. We roughed out the design on paper. As great as CAD is, nothing beats a sheet of quad paper, a mechanical pencil, and a big eraser for your first few design iterations.

Next I went to a big box home supply store - there are no more hardware stores in our neighborhood - and found parts such as a junction box, a power socket and a cable clamp. Since it wasn't exactly what I needed, yet another design iteration was called for. The result was this:

And on the outside it looks like this. The cable plugs into the wall and that powers up the outlet on top. We'll plug the power supply for our microcontroller into that outlet. The microcontroller's ground, 5V power, and signal lines will plug into the connector on the left. The amber LED on top indicates 5V power. The red LED indicates that the signal line is high, and that the outlet on the bottom should be energized.
In the next installment I'll write about the microcontroller and sensors.