Tuesday, January 14, 2025

Arduino Controlled VFO with OLED Display

When I saw this post in Hackaday about a DIY software defined radio receiver, what interested me most was the Tayloe mixer.  That lead me right down a rabbit hole. It's an ingenious design that lets you extract in-phase and quadrature signals so that you can do single side band (SSB) modulation/demodulation. It seemed like a excellent choice for a home-brew transceiver. Within this rabbit warren that I had entered, there were all kinds of designs, including some from The ARRL Handbook for Radio Communications. These designs needed relatively few parts: an oscillator, some analog switches, and an amplifier. The starting point is the variable frequency oscillator (VFO). The trick is that it needs to generate two square waves, one of them with a 90 degree phase offset. 

I had some Si5351 clock generators about, so I chose that as a starting point. There are two ways to accomplish quadrature clock signals with that chip. 

  • Generate a square wave at 4 times the frequency of interest, and create the quadrature clock signals using flip-flops.
  • Use the phase settings on the Si5351 clock generator to generate two clock signals, 90 degrees out  of phase.

So naturally, I chose the second option. That would be easiest, right? Nope.

I started with the examples in the etherkit libarary. At first I thought I could get away with just the set_freq and set_phase functions. It turns out that set freq automatically handles some settings in a way that conflicts with some of the phase setting rules. I would need to learn these rules and use the set_freq_manual function.

These are the rules:

  • The PLL (Phase Locked Loop) frequency must be set between 600 MHz and 900 MHz.
  • The PLL frequency must be must be a multiple of between 1 and 128 times the output frequency.
  • The multiple, when applied to the set_phase function, is equal to a phase shift of 90 degrees.
I made a spreadsheet to help figure this out. All the frequencies are in tens of milli hertz. The Si5351 takes frequencies as Unsigned Long Long integers. For each of the HF amateur bands, I tried to figure out an acceptable PLL frequency and multiplier (marked here as "phase"). I was able to do this for all but the 80 meter band. Oh well, I don't have room for an antenna that big!

Using the above table, I was able to independently frequency and phase using set_freq_manual and set_phase.

Next, I needed a way to control the Si5351. I based my circuit and code on work done by Peter, VK3TPM and Paul, VK3HN

Shopping List


Schematic

Code

The current Arduino file is: dc-vfo-06.ino. It makes the following improvements to the original design:

Frequency display is grouped by 1000s.
Add an arrow pointing to the digit or band being adjusted.
When the arrow points to the MHz place, the band is adjusted.
Frequency limits for each band.
Frequency memory for each band.

To use the VFO click the button on the encoder to select the place or band.
Spin the wheel to adjust the place or band. 

Here's the VFO in action. I'm using an inductive probe to connect the Tiny SA, which is showing the frequency. The phase relation ship is displayed on the oscilloscope. The Si5351 output is a 10 MHz square wave, but it looks like a sine because the scope is limited to 20 MHz.


To Do Next

Automatically switch sidebands based on selected band.
Display current sideband.
Add a momentary center-off toggle switch to select the digit being adjusted.
Design, implement, and test the mixer.


Saturday, December 23, 2023

APRS monitor with Raspberry PI

 APRS is a digital communication mode using a VHF radio, a modem, and a computer. Packets are sent over the air in a manner similar to the internet. It's used to send text messages, email, weather reports, and positions of emergency response assets.

Years ago I bought a muli-color LCD display from Adafruit for my Raspberry Pi 2. I finally got around to assembling it and was looking for an application. I figured if I wrote an app to monitor and decode APRS packets it would be an opportunity to better understand this interesting protocol.

The first part of this system consists of a Baofeng BF-F8HP radio and a interface board that I described in an earlier post. The Raspberry Pi 2 has no audio input, so I had to use a USB sound card dongle.  This used up one of the Pi's two USB ports. I was going to plug the Pi's other port into the interface board's "Push to Talk" (PTT) port, and then get the Pi on the network using an Ethernet cable, but since the code I'm running is very experimental, I thought it more prudent to use a WiFi dongle on the second port and keep the Pi on my guest network. Although PTT is not needed for this part of the project, I should be able to add it later using the Pi's GPIO pins.

I installed Direwolf,  a Terminal Node Controller (or modem), on the Pi with "sudo apt install direwolf". The sound card configuration in direwolf/config file looks like this:

ADEVICE  plughw:1,0
ACHANNELS 1

I started ~/direwolf/direwolf but it wasn't decoding the received messages. There turned out to be two problems with the soundcard dongle. One was that it couldn't handle the nearly 4 volt DC offset coming from the Baofeng, and the other issue was that the dongle was expecting microphone level signals. To handle the offset I added 0.15 µF capacitor to the signal line. Next I cut the signal level down by a factor of 20 by making a voltage divider using a 470 ohm resistor and a 10K ohm resistor.

Now for the Python stuff. I wanted to make a networked connection to Direwolf's so-called KISS (Keep It Simple Stupid) interface. I reality, I don't think it's that simple! I looked at two ways to access this interface. Using the Python KISS library, or just opening a TCP socket. 

Capturing packets in KISS 

    ki = kiss.TCPKISS(host='localhost', port=8001)
    ki.start()
    ki.read(callback=print_frame2)

Capturing Packets with a TCP socket

sock = socket.socket(socket.AF_INET, socket.SOCK_STREAM)
server_address = ('localhost', TCP_PORT)
sock.connect(server_address)
while(True):
    data = sock.recv(1024)

I settled on the KISS library because I was hoping that it would handle much of the packet assembly and disassembly. It was a little trickier that I though. I had to import the parse functions from both the aprs library and the aprslib library. These two functions do slightly different things. The aprs function really does a decode, and the aprslib function does the actual parsing.

        decoded_msg = str(aprs.parse_frame(msg))
        decoded_msg = decoded_msg.replace('*','')
        print('Decoded Message  = ' + decoded_msg)
        parsed_msg = aprslib.parse(decoded_msg)
        prettyprint.prettyprint(parsed_msg)

But in the end they turn this into a key-value dictionary:

b'\x82\xa0\xa8fbh`\x82\x90l\x8e\xa4@l\x96\x90l\x86\x9e\x9a\xe2\xae\x92\x88\x8ab@\xe0\x96\x90l\x84\x8c\x88\xe3\x03\xf0$GPRMC,054034,A,2048.6686,N,15622.0367,W,011,344,191223,,*00/Mobile in Maui Hawaii|#t%{|!wo^!'

I found that there were a few cases in which these functions were unable to parse a message. That will be something for me to figure out later.

Next I wanted to use the LCD display to show the SSID (station callsign + an identifying number) of the calling station, the time the message was received, and the location from which the message was sent. The SSID comes from the "from" key in the parsed message. The time comes from the system clock. The latitude and longitude are in the parsed data, but I wanted to show the name of the nearest town. For this, I found that a website that offers "reverse geo-coding". You supply the coordinates and it returns the name of the nearest town.  

Here's how the current state of the project looks:


Next: 

Add meaning to the colors. Currently the screen backlight color is random. Each type of message (position, wx report, text) should have an assigned color.

Add the ability to transmit. 


Saturday, November 11, 2023

Adding Trace Capture to the DSO Shell Oscilloscope

Introduction

The DSO Shell oscilloscope is about the least expensive oscilloscope you'll find. Its 200 kHz bandwidth excludes radio frequency work, but I think it's a pretty fun tool to have on the bench. One interesting, but partially implemented feature is that it can send the contents of a captured trace through its serial data port. To fully implement this you need a way to connect your computer to the 3.3 volt serial interface. That's pretty easy to solve with a CP2102 USB to UART module. The next problem is that to send the data, you have to simultaneously press the V/DIV and the ADJ buttons. It would be great if you could send a signal from your computer to trigger a trace capture. That's what this project does.

Opto-Isolators

To simulate pushing the V/DIV and  ADJ buttons, the transistor sides of 4N35 opto-isolators were soldered across SW1 and pins 4 and 5 of SW6. Then the diode sides were connected from ground to the DTR signal  the CP2102 module via 560 Ohm resistors. In the schematic below the line marked SD (Send Data) goes to DTR. DTR is the Data Terminal Ready signal that tells whatever device is connected to the computer that it may start sending data.


You can see in the photo that the chip is installed "dead bug" style (upside down) by the V/DIV switch pins.


For the ADJ switch pins, leave some space by the on/off switch for the plastic standoff on the bottom half of the case.

USB Interface

When I first connected the data SD lines to the CP2102 I discovered that DTR signal was enabled by default. So as soon as I plugged the 'scope into the computer it started sending data! Oops! I should have tried wiring the opto-isolators from the 3V3 pin to DTR instead of DTR to GND. Oh well, an easy enough fix was to use a PNP transistor to invert the DTR signal.
And I happened to have a 2N2907 in a nice metal TO-18 case with gold-plated leads.

I then cut a slot in the side of the case and mounted the CP2102 with 5-minute epoxy.


Software

As a starting point, I used Avra Mitra's excellent dso150PCplot.py script. I've added a function to trigger the Send Data signal.

def trigSD():
ser.setDTR(True)
sleep(0.1)
ser.setDTR(False)

This function is first used to find which USB port the oscilloscope is connected to. The modified script iterates through all ports, toggling DTR until it finds one that returns a text string containing "RecordLength". 

Then, each time the user taps the "Enter" key, a new trace is sent to the computer and displayed. 

The code can be found on GitHub.

Here's an example of a plot of the calibration signal. The bottom shows a time domain trace, and to top shows an FFT of trace below. Note that the amplitude of the third harmonic is about 1/3 of the fundamental. The math checks out! 

Future enhancements

For the hardware, it would be great if I could power the DSO with the USB cable. The device draws only 120 mA at 9V which would require only about 250 mA on the USB supply line.  That, however, would require a step-up switching power supply. It might just barely fit inside the case, but upon consideration, putting a noisy switching power supply so close to the internal analog circuits may not be a good idea. Better to use a USB break-out board for the switcher outside the case and loop back to the power plug.

For the software, I'd like to add a log/log option to the FFT. I'd also like to print the trace statistics and scope settings which are conveniently sent along with the actual trace data.


Thursday, May 12, 2022

Measuring Capacitors and Inductors with a NanoVNA

The NanoVNA is an amazing little instrument that puts test capabilities into the hands of hobbyists that were once only found on laboratory benches. One thing I wanted to do with mine was to measure capacitance and inductance without reading it directly from the Smith chart. To do this I started out making a jig from a couple SMA connectors and a terminal block. I used two connectors because eventually I want to use it to test filters, but for now I'm just using one terminal.

As you'll see, this isn't really a tutorial or how-to. It's my on-line lab notebook, complete with errors and unsolved puzzles. This was also an excuse to familiarize myself with a LaTeX equation editor plug-in.


To calculate the capacitance and inductance, you need to first measure reactance. Reactance is the characteristic of capacitors and inductors that opposes alternating current. I attempted to measure the reactance of two components:

A ceramic capacitor marked "65 - J" - a 65 picofarad capacitor. 

An inductor made from a T37-6 Toroid with ten turns of magnet wire. According to this website:  https://toroids.info/T37-6.php, the inductance should be 0.30 microhenries.

The technique I found that worked the best for me was to get the measurement set up on the NanoVNA, and then perform a calibration before I actually wrote down the numbers displayed on the screen.

Here's the setup:

From the base menu select only one trace:DISPLAY, TRACE, TRACE 0
Set reactance for capacitors and inductors: DISPLAY, FORMAT, MORE, REACTANCE
Select port: DISPLAY, CHANNEL, CH0 REFLECT.
Set a frequency start and stop STIMULUS, START, 1M, STOP, 30M
Adjust the scale and offset for a full screen graph: DISPLAY, SCALE, SCALE/DIV, <###>,  REFERENCE POSITION <###> 

Now perform a calibration (CAL, CALIBRATE) using the provided open, short, and load standards. Applying them at the end of the short test lead, rather than at the chassis NanoVNA should yield the best results.

The Nano VNA displays reactance in ohms on the top center and frequency on the top right. Note that the reactance is negative because our load is capacitive. 


As expected, the capacitor's plot, in addition to being negative, is curved because of its reciprocal relationship between frequency and reactance.

This is the equation for capacitive reactance:

$$X_C = \frac{-1}{2\pi f C }$$ 

It can be solved for capacitance if you know the frequency.

 $$C = \frac{-1}{2\pi f X_C }$$

I used the NanoVNA's cursor to measure the reactance at seven points and calculated the capacitance.

Capacitors typically have a tolerance of 20% which means that the measured value of this 65 picofarad capacitor was correct almost all the way to 30 Mhz. It's strange that the error changed with frequency.

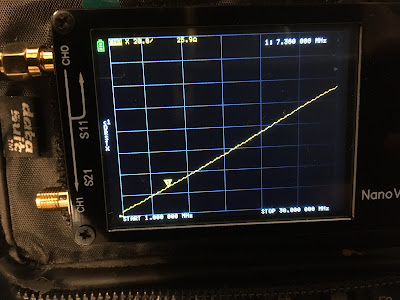
For the inductor, the trace is positive and linear because the inductance is proportional to the frequency.


This is the equation for inductive reactance:

$$X_L = {2\pi f L }$$ 

It can be solved for inductance if you know the frequency.

 $$L = \frac{X_L}{2\pi f }$$

Again, I used the NanoVNA's cursor to measure the reactance at seven points and calculated the inductance.


Hmmm. Welp, the measured inductance almost twice the calculated inductance. And, the error increases with frequency again. Not sure what's going on here. Let's connect both the capacitor and the inductor, and see where it resonates, this time using the using FORMAT, RESISTANCE, rather than FORMAT, REACTANCE.


Resonance is occurring at 29.400 MHz. Since we can read frequency fairly accurately and the value of the capacitor is printed right on it, we may be able to cross-check our impedance value.

The formula for resonance is:
 $$f_0 = \frac{1}{2\pi \sqrt{LC} }$$

And solving for L:
$$L = \frac{1}{C(2\pi f_0)^2}$$

Plugging in the values for capacitance (measured as 79.8 pF at resonance) and frequency (29.8 MHz) the above equation yields an inductance of 0.37 uH. That's only 23% off the predicted value. Not too bad, even if my methods are questionable!

Let's do a double check on that resonance while we're at it. Resonance is where the capacitive and inductive reactances cancel out. If we plot their absolute values, it's where they cross on the graph.


It looks like the point at which the reactance lines cross is about 24 MHz, significantly lower than the 29.4 MHz resonance. Because of the shallow slope of the lines, capacitance only has to be a little lower or the inductance a little higher to move the crossover point significantly, so maybe this method's not too practical. 

I now have a few questions for further investigation.
  • Why did the values of capacitance and inductance increase with frequency?
  • Would I have gotten better results if I had chosen a capacitance that results in a steeper slope?
  • Can I obtain a more accurate measurement if I construct RC and RL filters using high precision resistors and calculate C and L based on their their 3 dB attenuation points?

Saturday, January 8, 2022

Stellar Time Lapse

As you may have seen in an earlier post, I had made an Arduino-based remote intervalometer for my EOS camera, with the intention of making a time-lapse of stars and hopefully the Milky Way rotating over the Pacific Ocean. I had gotten the inspiration for it when reviewing some exposure bracketing I had done when making some still images. When quickly reviewing the images it looked almost like a movie, so I adjusted the brightness and contrast of the images, and strung them together as a video proof of concept:


Over the holidays I got a chance to try it for real. There were a few changes I wanted to make to the intervalomenter to prepare. To implement these changes I needed to add a rotary encoder with a push-button. The initial design enables changing of intervalometer settings while it was running, but that would have required three interrupts, and the Arduino Nano has only two. So instead, I tied the push-button to one of the interrupts and used it cycle through four states. The interrupt routine still needs some debouncing, as it's currently pretty easy to accidentally skip a state.

Here are the states:

1) Run:

Periodically trigger a shutter release while displaying the mode and time to trigger on the LED display.

2) Change operational mode:

A: Interval in seconds and immediate shutter release.

B: Interval in seconds and delayed shutter release.

C: Interval in minutes and immediate shutter release.

D: Interval in minutes and delayed shutter release.

3) Adjust the interval from 1 to 99 seconds or minutes.

4) Adjust the duty cycle of the display from full-on to full-off in increments of 10%.

All of these worked fine, except for the fourth. I thought this feature would be helpful because the display was so bright and got so warm, I was concerned that it would drain the intervalometer battery before the camera battery was drained. It turned out that the display was just as warm with the LEDs disabled.  Since this feature didn't do what I had intended, I ended up just unplugging the power from the display, once the intervalometer was started.

I found that an interval of 30 seconds would look pretty good. And, with a 10 second exposure and the 15 seconds it takes for the camera to process the image, it's quite possible. However, I found that when doing time exposures, the camera's battery lasts only between 150 and 180 images, and that makes a video that's only five or six seconds long, covering only 90 minutes of real time at most. So until I can set up an external power supply for the camera, I've set the interval to 60 seconds and made the video with 2 frames for each image, or 15 rather than 30 frames per second.

I used the following camera settings:

    Sensor/Lens combination: Crop/12mm
    Aperture: f2.8
    Exposure: 10 Seconds
    ISO: 12800
    Image Size: S2 1920 x 1280
    Display: Min brightness to save energy.
    Long Exposure Noise Reduction: Enabled

I made the video in Kdenlive by selecting "Project", "Import Slide Show Clip", importing the still images, then setting "Frame Duration" to "00:00:00,2".


It turned out pretty well, especially the way it shows Venus and Jupiter setting on the Pacific. One thing that bothered me, and you'll probably notice it now that I mention it, is that occasionally the image jerks. I wondered if there could be some missing images, so I wrote this script to calculate the intervals between all the images. And, sure enough, occasionally the interval was 120 or 180 seconds rather than 60 seconds.
Perhaps using an infrared shutter release wasn't the best idea. Maybe a wired shutter release would be more reliable. I also checked the Arduino specs and it turns out that the the digital pins can only source 20 mA. I should have driven the LED with a transistor that would have provided more current.

One happy coincidence occurred on the night of my first test run. The night of January 1st was the first night in almost two weeks that the sky hadn't been completely obscured by rain clouds. I didn't notice anything unusual in the sky until I had assembled the still images into a video. Was that a comet in the first second of the video? Yes! Here's a still from that sequence. Just go straight up from the palm tree. It's comet Leonard which, according to NASA, will never be seen again because if it survives its closest approach to the Sun, it will continue on a trajectory out of the solar system.


Friday, January 7, 2022

Messages from Space 2021

Every year between Christmas and New Years Day, the International Space Station reconfigures their amateur repeater to continuously send slow scan television images to Earth. Slow scan television is something like a facsimile image. The color and brightness of each horizontal line of the image is represented by audio tones transmitted over the radio. To receive these images you need a VHF FM radio receiver and software to record and decode the images. You also need software loaded with what are called the "Keplerian elements" -  numbers that predict the orbit of satellites such as the ISS. This enables you to tell when to tune in and where to point the radio antenna. Typically a satellite will be in range for ten or so minutes when it passes overhead. 

Last year I posted a slow scan television image that I received on from the International Space Station over the winter break. For that I used my FT-2980 transceiver wired to my PC and a ground plane antenna. The images I received were pretty clean.  This year I was visiting relatives and had only a laptop and an FT-60 handheld with a "rubber duck" antenna. With the assistance of my niece, we tuned in and held the radio up to the laptop and were able to capture some images. 


Quality wasn't perfect because the microphone in the laptop picked up sounds around us - such as this:


The software we used to decode the images was called QSSTV. This app not only converts the tones into an image, it provides some visualization of the incoming signal. If you are wondering what a rooster crow looks like in a waterfall plot, here it is:


A waterfall plot breaks up tones and displays the lower tones on the left and higher tones on the right. As new tones are captured and analyzed, they are added to the top, and the image scrolls down. Most of the fuzzy lines across the images, however, occurred when the signal from space randomly faded out. It wasn't because of the chickens!

The theme this year was lunar exploration, and there were twelve different images sent commemorating various moon missions. All amateur radio stations must identify themselves, so in the images you can see the U.S. callsign NA1SS and the Russian callsign RSOISS. The onboard station is operated by astronauts from both nations.

ARISS (Amateur Radio on the International Space Station) was offering a certificate for anyone sending a copy of their captured image along with information about how and when the image was received. We filled out the form, sent it in, and the next day received this certificate:


Sunday, November 21, 2021

Canon EOS Remote Intervalometer

To create a time lapse video, you need to take a bunch of still images and stuff them into a video editor. The trick is you don't want to have to stand there with a stopwatch for hours, snapping hundreds of photos. Thus the need for an intervalometer - a device which repeatedly trips the camera's shutter. Some cameras already have this feature, and there's custom firmware such as Magic Lantern or the Canon Hack Development Kit which implement the feature, but I wanted to have the opportunity to experiment a little. My main goal is to make videos of the Milky Way as it rotates across the sky. On my camera (a Rebel SL1), I use a 15 second exposure at ISO 12800, and then the camera takes about 20 seconds to process each image. For this reason, I decided to start with a 60 second interval. At this interval, every hour in real-time compresses down to two seconds of video. 

My camera uses an infrared remote, which is ideal, because there's less chance of bumping the camera, causing a shaky image. I have a remote like this. According to various sources on the web, the remote triggers the camera by sending out two 32 kHz pulse trains. If the pulse trains are 5.35 mS apart, the camera triggers with a two second delay accompanied by beeping. If the pulse trains are 7.35 mS apart, the camera triggers immediately. To confirm that this is how it works, I disassembled a photo-interrupter, and removed the phototransistor. I then connected it to a 5 volt source through a 1 kOhm resistor. Because the frequencies involved are rather low, I was able to use my DSO Shell oscilloscope, which has a max speed of only 10 uS per division. 


Sure enough, there were two pulse trains at 32 KHz. I set an Arduino up to drive a 950 um LED at 32 kHz every 5.35 mS and to my surprise it only worked if I waved it all around the camera. If I pointed it directly at the receiver in the front of the camera's hand grip, it didn't work at all. The signal looked good...


Going back to the Amazon remote, I noticed that even if you held the button down, it only sent two pulses trains. I had though that if I sent more pulse trains, the remote would be more reliable. Since that wasn't the case, I added a button to the project that allowed only two pulse trains per button-push. Now it worked reliably. 

One other improvement I added, was that I wired the infrared LED in parallel with the Arduino Nano's internal LED on pin 13. That way you can tell when the LED is on. There's another way you can tell, though. Look at the LED with an old or inexpensive webcam. In the image below, you can see the infrared LED glowing white when viewed through my webcam.
 

This infrared-viewing trick used to work with the camera in my old Palm Pilot, but it doesn't work with my  iPhone. I assume it's because Apple added an infrared filter to the higher quality iPhone camera.

The next step was to make it send two pulse trains every 60 seconds. That was easy but I wanted a count-down timer so I'd be able to tell if the intervalometer was running, and to see how long until the next exposure. In my junk box I had three HP 5082-7340 LED display modules from the 1970s. These displays have nice-looking numbers compared to most seven-segment displays and have on-board memory so your microcontroller doesn't have to tie up processing cycles doing a multiplexed driver scheme. In the days when microcontrollers were expensive these displays were a great idea. Now they're just nostalgic - but I was surprised to see some vendors asking as much as $20 on Ebay, especially since you can get an OLED graphical module for less than $10 these days. 

Here's how the current project looks. Please ignore my ugly wiring! Whenever I try cutting leads to some exact length, they always come out either slightly too long or worse yet, slightly too short. I really need to make some kind of template. So for now, I just use longer jumpers and let the wires go everywhere! 


I have the first digit displaying the letter A, just because it can. Maybe that will be some kind of mode designator in the future. One thing I don't like about these LED displays is that they get kind of warm. That's probably causing excessive battery drain when I'm powering it that way. In the future I may use the display's blanking control as a dimmer so it doesn't use so much juice.

Another thing I want to change is the brightness of the power LED on the Nano. It's so distracting! Rather than attempting to change the microscopic resistor in the circuit, I may just put some white paint over the LED!

Finally another feature I'd like to add is a start/stop button and a way to adjust the interval.

You can find the Arduino source code here.